
TLDR#
In the logistics industry, optimizing warehouse layouts is crucial for efficiency. Our Python-based layout generator addresses the common challenge of lacking publicly available warehouse designs. By customizing dimensions and leveraging visualization tools, this generator produces both 2D and 3D graphical representations of warehouse layouts. Key functionalities include dynamic layout generation, storage location management, and the creation of an underlying graph for optimization. The tool simplifies the setup process, generates distance matrices, and provides accessible visualizations, aiding in effective logistics management. Explore the complete code and start optimizing your warehouse today.
Introduction#
The world of logistics is full of interesting optimization challenges like the storage location assignment problem or the order picking problem. But to solve these problems we need input data. While we can relativly easy generate order data, there is a lack of publicly available warehouse layouts that are needed to generate distance matrices and to visualize storage assignments or picking routes.
To close this gap I wnt to present a layout generator I developed in python. It enables the fast creation of multidimensional layouts and generates an underlying graph that can be used for solving optimization problems. Further we can leverage vizualization libraries like matplotlib and plotly to generate a graphical representation of a warehouse.
Core Datastructures#
One of the core functionalities of the Layout class is the management of storage locations within the warehouse.
The approach to generating the warehouse layout is dynamic and adaptable, allowing for customization based on user-defined parameters. By specifying dimensions such as length, width, height, and the option for double-deep storage, users can tailor the layout to suit their specific requirements.
The key inputs are the number of rows, the number of columns and the height. To quickly set up a layout we simply spread warehouse racks across the length of the warehouse. We leave the row on top and on bottom out and leave space between the warehouse racks for walkable aisles.
def gen_layout(self, n_rows=10, n_columns=10, n_levels=3, double_deep=True):
    if double_deep == True:
        layout_grid = np.ones((n_rows, n_columns, n_levels)) * -1
        for i in range(n_levels):
            layout_grid[:, ::3,i] = 0
    elif double_deep == False:
        layout_grid = np.zeros((n_rows, n_columns, n_levels))
        layout_grid[:, ::2] = -1
    layout_grid[0,:] = 0
The above code snippet creates a representation of the layout as a multidimensional numpy array. In the numpy array storage locations are encoded by the dummy value “-1” and walkable locations by “0”.
We can easily vizualize the generated layout as a heatmap:
Here you can see the 2-D representation of the first level that includes the storage locations and the walkable aisles that are used to access the storage locations:
In the case of a layout with two or more levels we can use a 3-D scatterplot to display the layout. Note how the lowest level is equal to the 2-D heatmap:
For our convenience there exist two helper functions that store the index of all storage locations and a mapping that allows us to retrieve from which aisle and what coordinate a storage location can be accessed.
def gen_storage_locs(layout_grid):
    storage_locs = []
    all_locations = np.where(layout_grid == -1)
    for loc in range(len(all_locations[0])):
        x_storage = all_locations[0][loc]
        y_storage = all_locations[1][loc]
        z_storage = all_locations[2][loc]

        storage_locs.append((x_storage, y_storage, z_storage))
    storage_locs = storage_locs
    return storage_locs

def gen_access_mapping(layout_grid):
    access_mapping = {}

    all_locations = np.where(layout_grid == -1)
    for loc in range(len(all_locations[0])):
        x_storage = all_locations[0][loc]
        y_storage = all_locations[1][loc]
        z_storage = all_locations[2][loc]

        if layout_grid[x_storage, y_storage - 1, 0] == 0:
            access = (x_storage, y_storage - 1, 0)
            aisle = access[1]
        elif layout_grid[x_storage, y_storage + 1, 0] == 0:
            access = (x_storage, y_storage + 1, 0)
            aisle = access[1]
        access_mapping[(x_storage, y_storage, z_storage)] = {"aisle" : aisle, "access": access}

    return access_mapping
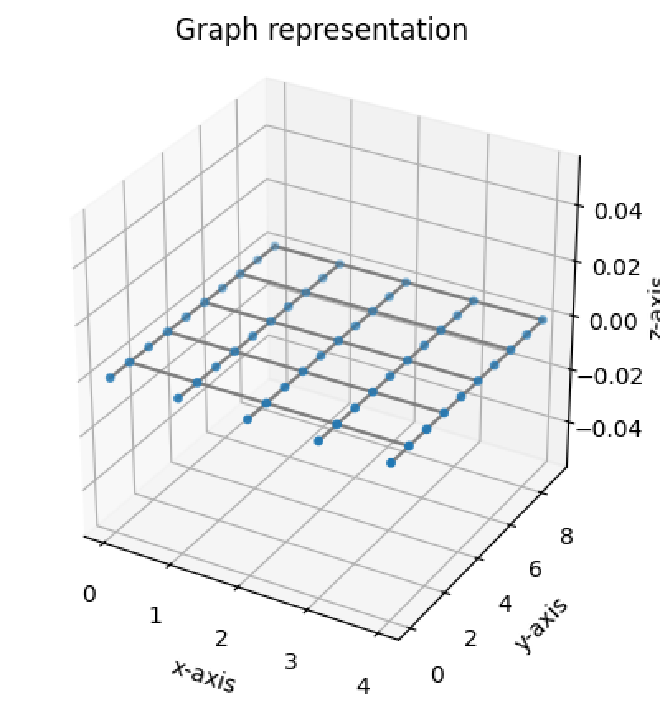
By iterating over the numpy array we can create a graph representation of the warehouse layout. This will result in an undirected, weighted graph that allows us to calculate a distance matrix with the floyd warshall algorithm. In the Figure below you can see a graphical representation of a graph of a small warehouse layout.
Layout Generation#
To make the layout generation process more convenient I created a python class that takes care of the complete process.
The code snippet below shows the creation of a Layout object.
warehouse = Layout(x=5, y=3, z=1)
double_deep = "False"
path = os.path.join("data/cache/dist_mats/", "dist_mat_" + str(warehouse.layout_grid.shape) + "_" + str(double_deep) + ".npy")
if os.path.exists(path):
    dist_mat = np.load(path)
else:
    dist_mat = warehouse.gen_dist_mat(path)
warehouse.grid
      [[ 0.,  0.,  0.],
       [-1.,  0., -1.],
       [-1.,  0., -1.],
       [-1.,  0., -1.],
       [ 0.,  0.,  0.]]
The complete code can be found here: